ページタイトル

ESG Data

Coverage of ESG reporting

ESG data is compiled on a global consolidated basis, which includes Mitsui Kinzoku as well as domestic and overseas consolidated subsidiaries. Any differences are indicated in the notes.

About environmental data
・Totals do not add up in some cases due to rounding off of fractions.
・ Blank cells in some tables are due to no data collection at that time.
・ Part of the data for previous fiscal years have been revised due to a review of the calculation results.

About the scope of employee data
・Mitsui Kinzoku:MITSUI MINING & SMELTING CO., LTD.
・Domestic (consolidated):domestic consolidated basis, which includes Mitsui Kinzoku as well as domestic consolidated subsidiaries.
・Global (consolidated):global consolidated basis, which includes Mitsui Kinzoku as well as domestic and overseas consolidated subsidiaries.
 

Environment

CO2・Energy

CO2 emissions from energy consumption (thousand t CO2
(Scope 1, 2)

  FY2018 FY2019 FY2020 FY2021  FY2022
Scope1 Japan
707  720  737   755  763 
Asia (except Japan) 28  35  35  33  32 
America (North, South and Central America)
13  10 
Europe (including Morocco)
0.1  0.3  0.1  0.4  0.5 
Subtotal
748  766  779  797  802 
Scope2 Japan 541  587  707  692  661 
Asia (except Japan)
323  320  324  313  245 
America (North, South and Central America)
38  18  12 
Europe (including Morocco)
0.6  0.6 
Subtotal
903  926  1,044  1,015  918 
Total  1,651  1,692  1,823  1,812  1,720 
Per-unit energy-derived CO2 emissions
(per sales, t-CO2/million yen)
3.3  3.6  3.5  2.9  2.6 

CO2 emissions from energy consumption by business sector (thousand t CO2
(Scope 1, 2)

  FY2018 FY2019  FY2020  FY2021 FY2022 
Scope1 Metals 590  620  642  654  661 
Engineered materials 69  62  59  59  49 
Mobility/Automotive parts & components 17 
Others/Affiliates coordination 87  82  76  81  76 
Mitsui Kinzoku Head Office and administrative sites 0.1  0.1  0.1  0.1  0.1 
Subtotal
748  766  779  797  802 
Scope2 Metals 387  458  589  558  563 
Engineered materials
415  377  375  372  254 
Mobility/Automotive parts & components
37  35  30  27  59 
Others/Affiliates coordination
62  54  48  56  40 
Mitsui Kinzoku Head Office and administrative sites
1.4 
Subtotal
903  926  1,044  1,015  918 
Total
1,651  1,692  1,823  1,812  1,720 

*1  Figures for CO2 emissions from energy consumption were calculated using emission factors derived in a manner conforming to the Act on Promotion of Global Warming Countermeasures. CO2 emissions from purchased electricity in Japan were calculated using the latest adjusted emission factors of electric power suppliers (basic emission factors were used until FY2019). For overseas emission factors, we used the per-country emission factors, the CO2 Emission Factors from Electricity for 2021 reported by IEA (Until FY2020, the Electricity Emission Factors reported by GHG PROTOCOL were used).
*2  We have received independent practitioner’s assurance for the energy-derived CO2 emissions calculation. 
        Independent practitioner’s assurance report     FY2018 FY2019 FY2020 FY2021 FY2022
*3  Figures for FY2022 by business sector were based on the new organization started in April 2022, and those until FY2021 were based on the old organization.
  Others include the organizations under the Business Reconstruction Office of the Corporate Planning Department, and the Business Creation Sector.

GHG emissions other than energy-derived CO2 (t-CO2, Scope 1)

    FY2020  FY2021  FY2022 
Non-energy derived CO2
 Domestic 170,359   158,987  152,281 
   Overseas     143 
   Subtotal 170,359  158,987  152,424 
Methane (CH4)    Domestic 1,712  1,731  1,789 
   Overseas     28 
   Subtotal 1,712  1,731  1,818 
Dinitrogen monoxide (N2O)  Domestic 6,680  5,895  5,670 
   Overseas     50 
   Subtotal 6,680  5,895  5,720 
Total   178,751  166,613  159,962 

* Overseas figures added from FY2022. Figures until FY2021 covered only the domestic consolidated scope. 

CO2 emissions from logistics and waste treatment (t-CO2) (Scope 3)

  FY2018  FY2019  FY2020  FY2021  FY2022 
Logistics*1
19,518 19,306 19,703 18,496 18,163 
Waste treatment *2
43,625 34,400 25,430 27,977 11,528 

                                     
 *1   Non-consolidated basis in Japan. Data for FY2022 was obtained from the calculation made for the Category 4 boundary of Scope 3.  Up to FY2021, the scope of data calculation covered the transportations designated as Specified Consigner by the Act on the Rational Use of Energy. Calculation using the previous method gives a result of 17,465 t-CO2.
 *2  Global consolidated basis. Data for FY2022 was obtained from the calculation made for the Category 5 boundary of Scope 3. Calculation was performed based on the Basic Guidelines on Accounting for Greenhouse Gas Emissions Throughout the Supply Chain (Ver 2.5) using the emission factors by waste type/disposal method (excluding the waste transportation process) in the Emission Factor Database on Accounting for Greenhouse Gas Emissions Throughout the Supply Chain (Ver 3.3). For the emission factors up to FY2021, the emission intensity database for calculating GHG emissions of organizations throughout the supply chain, Japan‘s Ministry of the Environment and Ministry of Economy, Trade and Industry (Ver. 2.6 and Ver. 3.0) was referenced.

Energy consumption (crude oil equivalent in kl)

  FY2018  FY2019  FY2020  FY2021   FY2022
Domestic 447,784 474,435 555,306 581,007 564,547 
Overseas 168,094 156,198 155,033 158,467 130,044 
Total 615,878 630,634 710,339 739,474 694,591 
Per-unit energy consumption
(per sales, kl
/million yen) 
1.2 1.3 1.4 1.2 1.1 

Total power generation using renewable energy (GWh)

  FY2018 FY2019  FY2020  FY2021   FY2022
Hydraulic 194.9 291.4 267.1 271.7 277.4 
Geothermal 178.8 127.3 132.2 107.4 106.8 
Photovoltaic 3.1 3.1 4.5 6.1 7.4 
Total 376.8 421.8 403.8 385.2 391.5 

Waste, water, air and hazardous materials

Breakdown of usage by type of raw material (thousand tons)

  FY2020  FY2021   FY2022
Unused natural resources such as ore 1,878 2,168 2,004
Unused products, intermediate products and parts manufactured or processed in the Group 127 90  82
Unused products, intermediate products and parts manufactured or processed by other companies 952 1,354 1,051
Materials recycled from waste of products once used 627 713 659
Processing stage defective articles and processing losses 101 108 106
Total 3,684 4,432 3,902

Waste generation by types / disposal methods (thousand tons)

   FY2022
 Hazardous waste (Specially controlled industrial waste) 5.5
   Of which, recycled  4.7
 Non-hazardous waste  (Industrial waste & Municipal waste) 31.3
   Of which, recycled 15.2
 Total   36.8
    Of which, recycled 19.9

* The amount recycled includes recycling, reusing, and thermal use. Excluding tailings waste.

Amount of waste generation (excluding recycling)(thousand tons)

  FY2018  FY2019  FY2020  FY2021  FY2022
Domestic 32.7 18.5  16.2  18.8 16.6
Overseas 1.5 1.5 1.3 1.2 1.1
Total   34.2 20.0 17.5 20.1 17.7

*Waste generation, excluding recycling (recycling, reusing, and thermal use). Excluding tailings waste.

Amount of tailings waste generation (thousand tons)

  FY2018  FY2019  FY2020  FY2021  FY2022
Domestic 82.3 72.9 73.0  71.4 72.5
Overseas 449.7 456.8 249.5  336.2  311.4
Total   532.0  529.7  322.6 407.7  383.9

Amount of plastic waste generated (thousand tons)
 Breakdown and percentage of recycling

 
FY2021   FY2022
Plastic waste generated in processes for manufacturing plastic products   0.4  0.3 
 
 Of which, recycled 0.3   0.2 
Plastic packaging and packing materials generated in distribution or sales processes 0.9  0.9 
 
 Of which, recycled
0.3  0.3 
Other plastic waste generated in operations such as construction and manufacturing
0.9  0.9 
 
 Of which, recycled 0.2  0.1 
Total 2.2  2.1 
   Of which, recycled 0.8  0.6 

Volume of chemical substances released and transferred (tons/year)

  FY2018 FY2019 FY2020 FY2021 FY2022 
Released Domestic 2,104.3  1,836.5  1,951.5  1,952.9  1,716.1 
Overseas       645.3  674.7 
Subtotal
 2,104.3  1,836.5  1,951.5  2,598.2  2,390.8 
Transferred Domestic 223.8  313.1  446.6  601.7  551.6 
Overseas       10.9  16.1 
Subtotal 223.8  313.1  446.6  612.6  567.7 

*Added data for overseas sites from FY2021.

Breakdown of chemical substances released and transferred

   Unit  FY2022
 Amount released into  Soil  t 210
 Public waters  t  84
 Atmosphere  t  107
   Of which, VOCs kg  10,952
   Of which, dioxins mg-TEQ
177
   Of which, mercury and mercury compounds kg 210
   Of which, lead compounds  kg  784
   Of which, chromium and chromium compounds  kg  23
   Of which, cobalt and cobalt compounds  kg  0
   Of which, nickel compounds  kg  67
 On-site landfills  t  1,990
 Subtotal  t  2,391
 Amount transferred to

  
 Sewers t 0.1
 Waste t  568
 Subtotal t  568

*Calculated based on the PRTR system.

Emissions to the water (t)

   FY2020  FY2021   FY2022
BOD  Domestic 80.3  88.0  141.1 
Overseas 32.9  39.3  40.6 
Subtotal 113.3  127.3  181.7 
COD Domestic
130.4  128.1  183.1 
Overseas
97.9  114.5  111.6 
Subtotal 228.3  242.5  294.8 

Emissions to the atmosphere (t)

    FY2020  FY2021  FY2022 
Soot and dust Domestic
73.1  90.2  80.4 
Overseas
2.8  14.0  15.5 
Subtotal 75.9   104.3   95.9 
NOx Domestic
406.9  460.1  470.0 
Overseas
8.2  27.7  16.7 
Subtotal
415.1  487.8  486.7 
SOx Domestic
181.1  192.9  240.7 
Overseas
2.8  6.5  4.3 
Subtotal
183.9  199.4  245.1 

Breakdown of water withdrawal (thousand m3)

  FY2020  FY2021   FY2022
Surface water (rivers and others)
792  761  829 
Groundwater (including underflow water)
4,670  5,213  4,876 
Rainwater
706  463  660 
Industrial water (supplied from offsite)
6,946  7,310  7,142 
Tap water 4,413  4,561  4,311 
Other freshwater* 34,810  39,290  36,171 
Seawater 71,182  76,028  74,967 
Total
123,519  133,627  128,956 

* Includes spring water generated from mines in domestic mining areas (23,098 thousand m3 in FY2020, 26,042 thousand m3 in FY2021, and 23,457 thousand m3 in FY2022). The water is not used for production purposes, discharged under our wastewater management.

Breakdown of wastewater (thousand m3)

  FY2020  FY2021  FY2022 
Discharged into sea
76,938  82,137  80,786 
Discharged into rivers
51,014  56,791  52,576 
Percolated underground
Sewage and others
439  392  349 
Injected into deep wells
1,477  1,426  1,284 
Others
567  325  327 
Total 130,440  141,080  135,324 

Amount of circulated water usage (thousand m3

    FY2020  FY2021  FY2022 
Reused (for the same purpose)
Domestic 19,368  19,796  20,130 
Overseas 2,791  2,618  2,277 
Subtotal 22,159  22,414  22,406 
Reused (for different purposes)
Domestic 8,370  8,714  9,702 
Overseas
Subtotal
8,375  8,719  9,705 
Recycled Domestic 1,003  1,154  1,251 
Overseas 813  1,155  984 
Subtotal 1,816   2,309  2,236 

Water withdrawal in water stressed areas (thousand m3)

  Water Stress Assessment  FY2022
Water Withdrawal
Percentage
Extremely High (>80%) Areas 51  0.09% 
High (40-80%) Areas 118  0.22% 
Medium - High (20-40%) Areas 1,950  4% 
Low - Medium (10-20%) Areas 50,496  94% 
Low (<10%) Areas 1,375  3% 
Total 53,989  100% 

* Water Stress assessment provided by AQUEDUCT Water Risk Atlas 4.0 released in August 2023. Excluding seawater.

Environmental Accounting, training and ISO

Environment-related capital expenditures and environmental management expenses
(Hundred million yen)

 
 FY2018 FY2019  FY2020 FY2021   FY2022 
Environment-related capital expenditure Domestic 30.6  24.7  5.5  18.5  20.7 
Overseas
4.9  12.1  3.1  3.5  3.8 
Subtotal
35.5  36.8  8.6  22.0  24.6 
Environmental management expense
Domestic 52.0  90.2  110.5  105.4  112.8 
Overseas
6.5  25.3  27.3  30.7  33.2 
Subtotal
58.5  115.5  137.8  136.0  146.1 

* Partially changed the classification of environmental management expenses after FY2019.

Break down of environmental management expenses
(Hundred million yen)

  FY2020  FY2021  FY2022 
Waste treatment outsourcing expenses 10.7  12.7  12.0 
Energy expenses 32.8  35.6  39.0 
Maintenance and repair expenses 27.3  29.0  27.2 
Labor cost 9.6  10.2  10.8 
Analysis expenses 3.6  3.4  3.8 
Others (office commodity expenses, etc.)
53.9  45.2  53.3 
Total
137.9  136.0  146.1 

Number of attendees in environmental training

  FY2020  FY2021   FY2022 
Environmental training 110  325  236 
 Rank-based training
 (including environmental training) 
409  299  -*3 

*1 The number of attendees of environmental trainings held at the head office of Mitsui Kinzoku, including attendees from Mitsui Kinzoku and domestic consolidated subsidiaries.
*2 Not including environmental trainings held at sites.
*3 Rank-based environmental education training not held in FY2022.

Coverage of ISO14001

  FY2020  FY2021   FY2022
Percentage of manufacturing sites *1  86%  86%  86% 
Percentage of all sites *2     76% 

*1 Revised data disclosed in the past due to subdivision of sites.
*2 All sites within the scope of global consolidation, including manufacturing sites, R&D center, sales sites and offices.

Social

Employees

Breakdown of consolidated employees by employment status and employment contract type
(as of the end of FY2022)

    Male Female Total
Open-ended workforce contract Full-time 9,088 3,457 12,545
Part-time 6 6 12
Total 9,094 3,463 12,557
Fixed-term contract Full-time 415 145 560
Part-time 77 47 124
Total 492 192 684
Total 9,586 3,655 13,241
Supervised workers 785 843 1,628
Total workforce 10,371 4,498 14,869

※ Since the calculation method is different from the one for temporary employees stated in the annual securities report, the total number of employees is not in accord.

Breakdown of consolidated employees by employment contract(as of the end of FY2022)

  Open-ended workforce contract Fixed-term contract  
  Male Female Male Female Total
Japan 5,328 864 397 114 6,703
North America 236 175 0 0 411
South and Central America 604 489 3 2 1,098
Asia 2,884 1,901 92 76 4,953
Europe 42 34 0 0 76
Total 9,094 3,463 492 192 13,241

New employee hires by region(as of the end of FY2022)

    Under 30 years of age 30-49 years old 50 years of age or over  
    Male Female Male Female Male Female Total
Japan New hires 163 45 194 44 50 9 505
Total employees 791 149 2,896 454 2,037 312 6,639
Rate of hiring 20.6% 30.2% 6.7% 9.7% 2.5% 2.9% 7.6%
North America New hires 10 6 29 11 16 7 79
Total employees 18 6 84 57 121 111 397
Rate of hiring 55.6% 100.0% 34.5% 19.3% 13.2% 6.3% 19.9%
South and Central America New hires 153 178 69 128 16 20 564
Total employees 183 202 277 241 137 48 1,088
Rate of hiring 83.6% 88.1% 24.9% 53.1% 11.7% 41.7% 51.8%
Asia New hires 403 242 221 93 5 17 981
Total employees 843 350 1,878 1,507 187 120 4,885
Rate of hiring 47.8% 69.1% 11.8% 6.2% 2.7% 14.2% 20.1%
Europe New hires 16 1 17 6 7 2 49
Total employees 8 1 15 10 18 23 75
Rate of hiring 200.0% 100.0% 113.3% 60.0% 38.9% 8.7% 65.3%
Total New hires 745 472 530 282 94 55 2,178
Total employees 1,843 708 5,150 2,269 2,500 614 13,084
Rate of hiring 40.4% 66.7% 10.3% 12.4% 3.8% 9.0% 16.6%

※ Since the calculation method is different from the one for consolidated employees, the total number of employees is not in accord.

Employee turnover by region(as of the end of FY2022)

    Under 30 years of age 30-49years old 50 years of age or over  
    Male Female Male Female Male Female Total
Japan Departures 55 22 92 22 122 13 326
Total employees 791 149 2,896 454 2,037 312 6,639
Turnover rate 7.0% 14.8% 3.2% 4.8% 6.0% 4.2% 4.9%
North America Departures 5 5 25 7 9 4 55
Total employees 18 6 84 57 121 111 397
Turnover rate 27.8% 83.3% 29.8% 12.3% 7.4% 3.6% 13.9%
South and Central America Departures 107 164 47 109 10 12 449
Total employees 183 202 277 241 137 48 1,088
Turnover rate 58.5% 81.2% 17.0% 45.2% 7.3% 25.0% 41.3%
Asia Departures 263 213 244 121 16 36 893
Total employees 843 350 1,878 1,507 187 120 4,885
Turnover rate 31.2% 60.9% 13.0% 8.0% 8.6% 30.0% 18.3%
Europe Departures 16 1 16 2 4 4 43
Total employees 8 1 15 10 18 23 75
Turnover rate 200.0% 100.0% 106.7% 20.0% 22.2% 17.4% 57.3%
Total Departures 446 405 424 261 161 69 1,766
Total employees 1,843 708 5,150 2,269 2,500 614 13,084
Turnover rate 24.2% 57.2% 8.2% 11.5% 6.4% 11.2% 13.5%

※ Since the calculation method is different from the one for consolidated employees, the total number of employees is not in accord. Departures includes “retirement at the age limit” and “expiration of contract period”.

Breakdown of consolidated employees by position
(as of the end of FY2022)

  Under 30 years of age 30-49 years old 50 years of age or over  
  Male Female Male Female Male Female Total
Managerial 4 0 753 106 627 31 1,521
Non-managerial 1,849 713 4,456 2,200 1,897 605 11,720
Total 1,853 713 5,209 2,306 2,524 636 13,241

Percentage of managers holding local nationality in overseas sites(as of the end of FY2022)

North America 75.0%
South and Central America 90.9%
Asia 84.8%
Europe 100.0%
Total 84.7%

Proportion of women as a percentage of new hires

  FY2018 FY2019 FY2020 FY2021 FY2022
Mitsui Kinzoku 20.0% 19.3% 15.0% 24.6% 19.0%
Domestic (consolidated) 23.5% 21.9% 18.5% 21.6% 19.4%
Global (consolidated) 37.4% 40.6% 46.6% 41.3% 37.1%

Proportion of women as a percentage of total employees

FY2018 FY2019 FY2020 FY2021 FY2022
Mitsui Kinzoku 11.1% 11.4% 11.2% 12.2% 13.5%
Domestic (consolidated) 14.8% 14.6% 13.9% 14.3% 14.6%
Global (consolidated) 30.5% 30.3% 28.6% 28.3% 27.6%

Number of emloyees in management positions by gender

  FY2018 FY2019 FY2020 FY2021 FY2022
  Male Female Male Female Male Female Male Female Male Female
Mitsui Kinzoku 605  9 630  14 637  16 676  21 712  20
Domestic(consolidated) 1044  15 1066  19 988  22 1103  28 1165  30
Global(consolidated) 1372  103 1344  115 1270  119 1381  125  1457  137
※ Since the calculation method is different from the one for "Breakdown of consolidated employees by position", the total number of employees in management positions is not in accord.
    

        Proportion of women in management positions

  FY2018 FY2019 FY2020 FY2021 FY2022
Mitsui Kinzoku 1.5% 2.2% 2.5% 3.0% 2.7%
Domestic (consolidated) 1.4% 1.8% 2.2% 2.5% 2.5%
Global (consolidated) 7.0% 7.9% 8.6% 8.3% 8.6%


                     Wage gap between male and female workers

  FY2022
  All workers Of which,
regular
Of witch, part-time and
fixed-term workers
Mitsui Kinzoku 67.7% 70.5% 53.1%
Domestic (consolidated) 63.5% 67.4% 53.7%

*Calculated based on provisions in the Act on the Promotion of Women’s Active Engagement in Professional Life.

*Female workers are paid less than male workers, which is attributable principally to the smaller percentage of women in management positions and to the average length of service of women being shorter than that of men (by about seven years).

                        Percentage of employees with disabilities

  FY2018 FY2019 FY2020 FY2021 FY2022
Mitsui Kinzoku 2.17% 2.32% 2.10% 2.16% 2.36%
※Revised the values for previous years.

                                            Rate of taking paid leave

  FY2018 FY2019 FY2020 FY2021 FY2022
Mitsui Kinzoku 77.1% 79.0% 70.5% 71.1% 78.9%
Domestic (consolidated) 72.6% 76.7% 67.3% 69.3% 77.8%

             
                  Overtime hours(Hours/month per employee)

  FY2018 FY2019 FY2020 FY2021 FY2022
Mitsui Kinzoku 14.0 13.7 13.2 14.0 13.8
Domestic (conslidated) 15.3 16.8 12.3 13.3 13.1

Parental leave

    FY2020 FY2021 FY2022
    Employees that entitled to leave Employees that took advantage Employees that entitled to leave Employees that took advantage Employees that entitled to leave Employees that took advantage
Mitsui Kinzoku Male 57 3 87 7 71 6
Female 8 8 17 17 15 15
Total 65 11 104 24 86 21
Domestic (consolidated) Male 145 9 184 15 175 21
Female 17 17 27 27 18 18
Total 162 26 211 42 193 39

※ Employees that took advantage: Employees that took parental leave in the relevant fiscal year of those entitled.

Return to work and retention rates after parental leave

    FY2020 FY2021 FY2022
    Ended Returned Retired Ended Returned Retired Ended Returned Retired
Mitsui Kinzoku Male 3 3 0 5 4 1 7 7 0
Female 4 4 0 0 0 0 14 14 0
Total 7 7 0 5 4 1 21 21 0
Domestic (consolidated) Male 11 11 0 13 12 1 26 26 0
Female 7 7 0 2 2 0 20 20 0
Total 18 18 0 15 14 1 46 46 0

※ Ended: Employees whose parental leave ended.
  Returned: Employees that returned to work after ended.
  Retired: Employees that separated from employment in twelve months after returning.


Results of stress check(Percentage of high stress)

  FY2018 FY2019 FY2020 FY2021 FY2022
Domestic (consolidated) 14.5% 14.7% 13.3% 15.6% 14.5%
* Target : Directly hired employees of Mitsui Kinzoku and
the domestic consolidated subsidiaries, including expatriate workers)

Human Rights

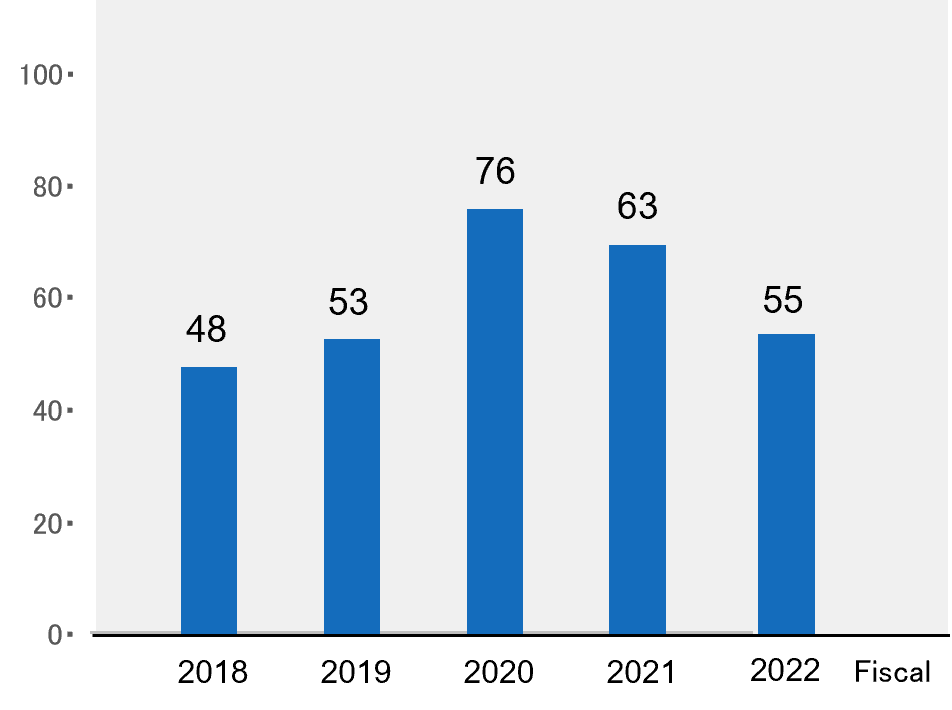
Number of attendees in human rights training

  FY2020 FY2021 FY2022
Japan 360 311 0
Overseas 0 67
*Human rights training at overseas sites scheduled for FY2020 and FY2021 was postponed due to COVID-19
* A systematic review of human rights training has been underway since FY2023, including renewal of the methods and contents.

Health and Safety

Number of accidents

    2020 2021  2022
 Mitsui Kinzoku Group*1 Serious accidents
1 0  0
Requiring days off 10 13  16
Not requiring days off  
25 22  29
Total
36 35  45
Cooperative companies and     
  contractors   
Serious accidents 1 0  0
Requiring days off 10 11  12
Not requiring days off 
10 4  16
Total 21 15  28
*1 Directly hired employees on a global consolidated basis.
*2 Revised the classification of not requiring days off in previous years.

Number of attendees in safety training

  FY2020 FY2021  FY2022
Safety training  71 489  281
Rank-based training
(including safety training)
 414 304 -*3 
*1 The number of attendees of safety trainings held at the head office of Mitsui Kinzoku, including attendees from Mitsui Kinzoku and domestic consolidated subsidiaries. Not including those held at sites.
*2 Rank-based safety training not held in FY2022.

Community Engagement

Mitsui Kinzoku Group breakdown of the amount

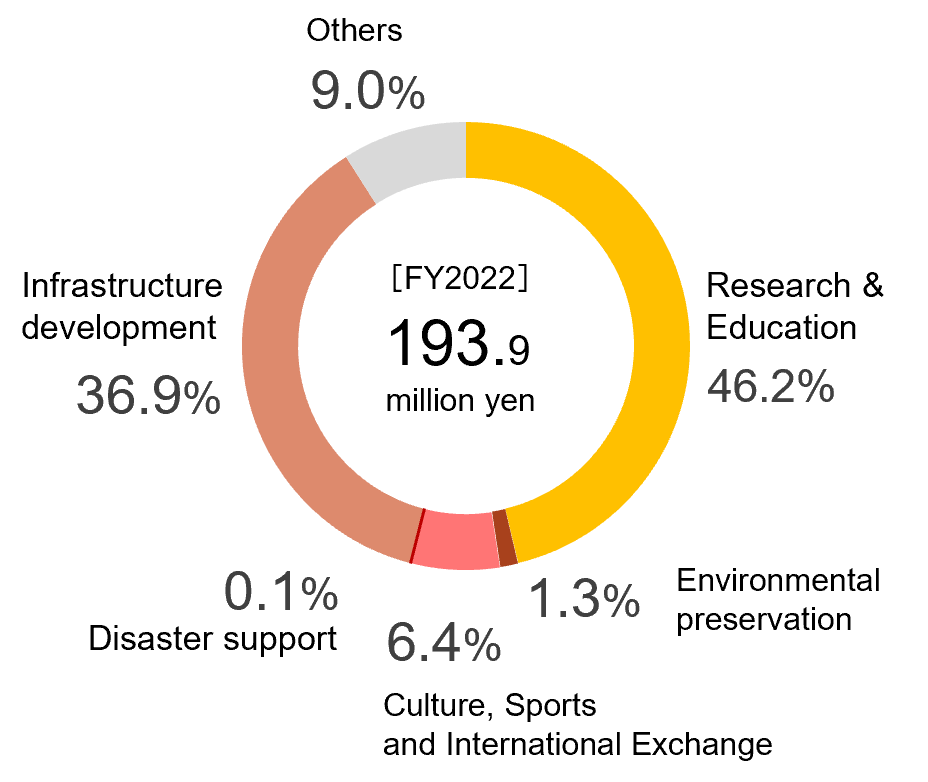
Changes in Amount (Millions of yen)

  
  FY2018 FY2019 FY2020 FY2021 FY2022
Global(consolidated) 278.5 150.0 134.3 191.8 193.9
  

Intellectual Property

Number of patent applications

 
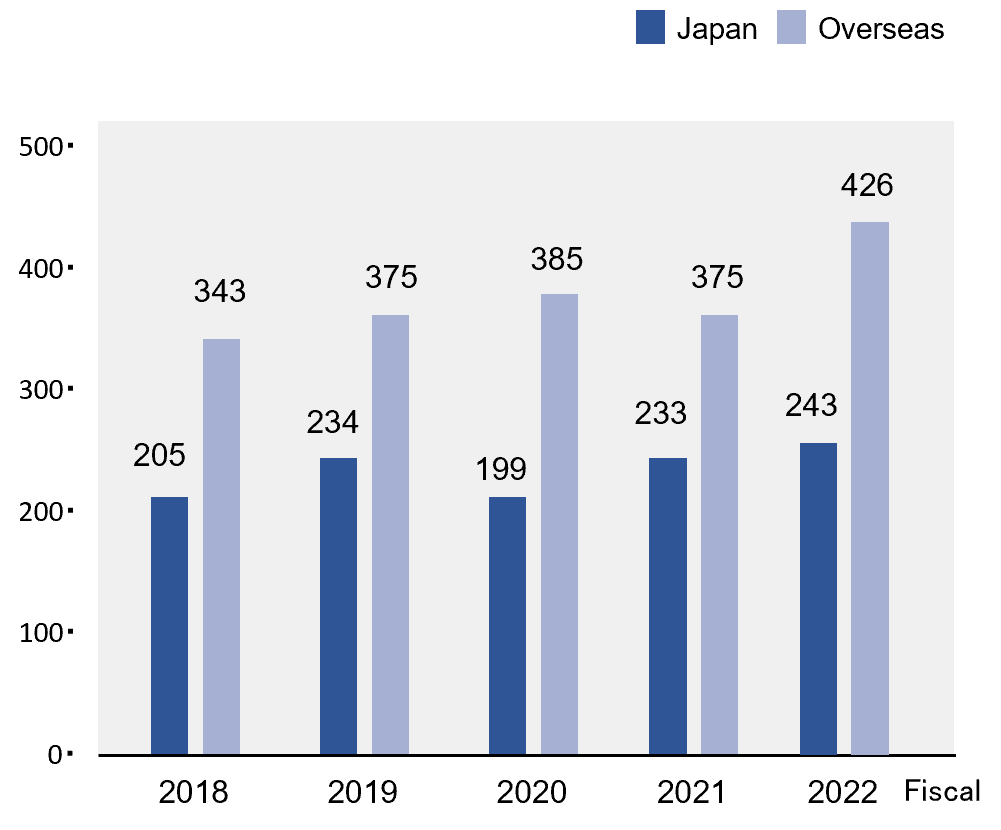
                * Due to our intellectual property data management systems,
some data differ from those reported last year.

Number of patents registered globally


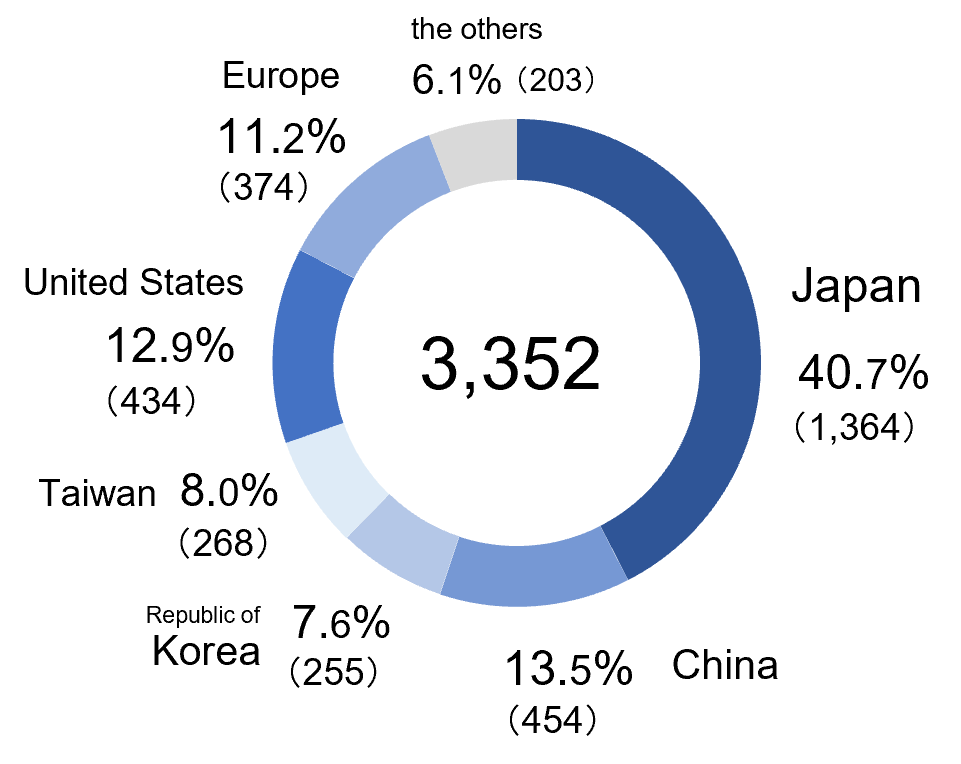
* Numbers as of the end of March 2023.

Quality Management

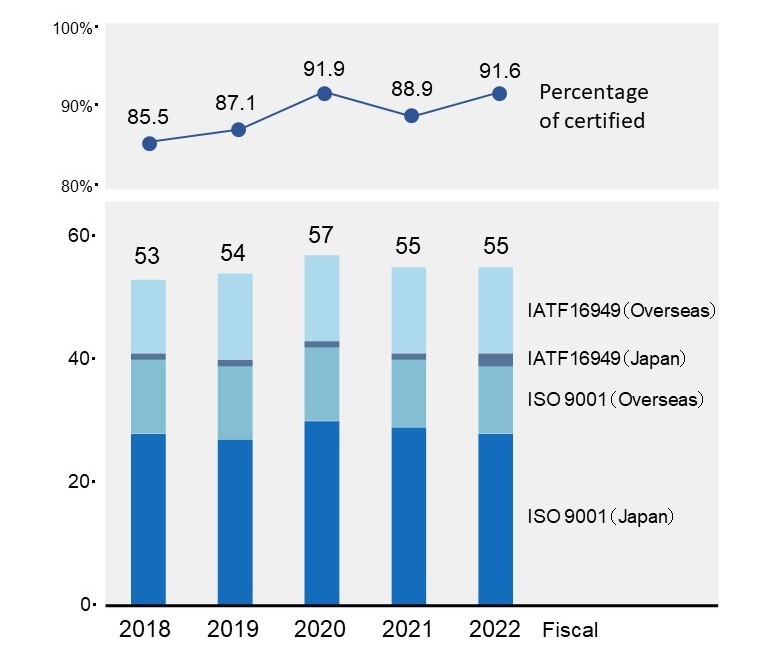
Number of operating sites with certifications

Number of claims at sites that hold QA meetings


* The values expressed as relative values, with the data of FY2013 being 100.

Governance

Compliance

   FY2018  FY2019 FY2020 FY2021 FY2022
Report of punitive legal action taken against Mitsui Kinzoku with respect to anti-competitive practices in FY2022 0 0  0  0  0
Report of punitive legal action taken against Mitsui Kinzoku with respect to bribery in FY2022 0  0  0  0  0

Coverage of reporting
We use cookies to improve site functionality, provide you with a better browsing experience, and to enable our partners to advertise to you.
Detailed information on the use of cookies on this Site, and how you can decline them, is provided in our privacy policy.
By using this Site or clicking on "Accepted", you consent to the use of cookies.